Excel / VBA
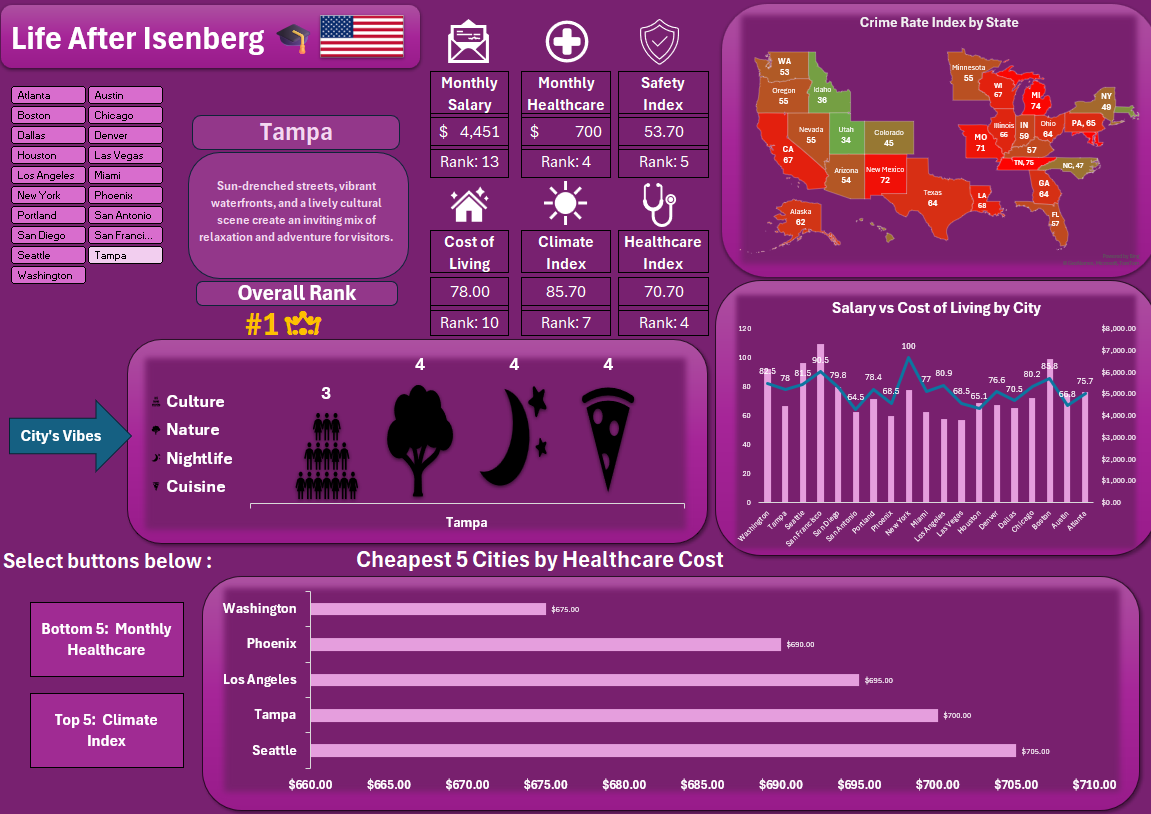
City Comparison Dashboard
Compared 15+ U.S. cities across salary, cost of living, healthcare and safety. Built with dynamic slicers, VBA macros and conditional formatting.
View Project →
MS Business Analytics · UMass Amherst
I work with data to help people make better decisions. My background covers healthcare, energy, and hospitality — now focused on analytics and operations.
🟢 Open to Summer / Fall 2026 internships · OPT/CPT eligible



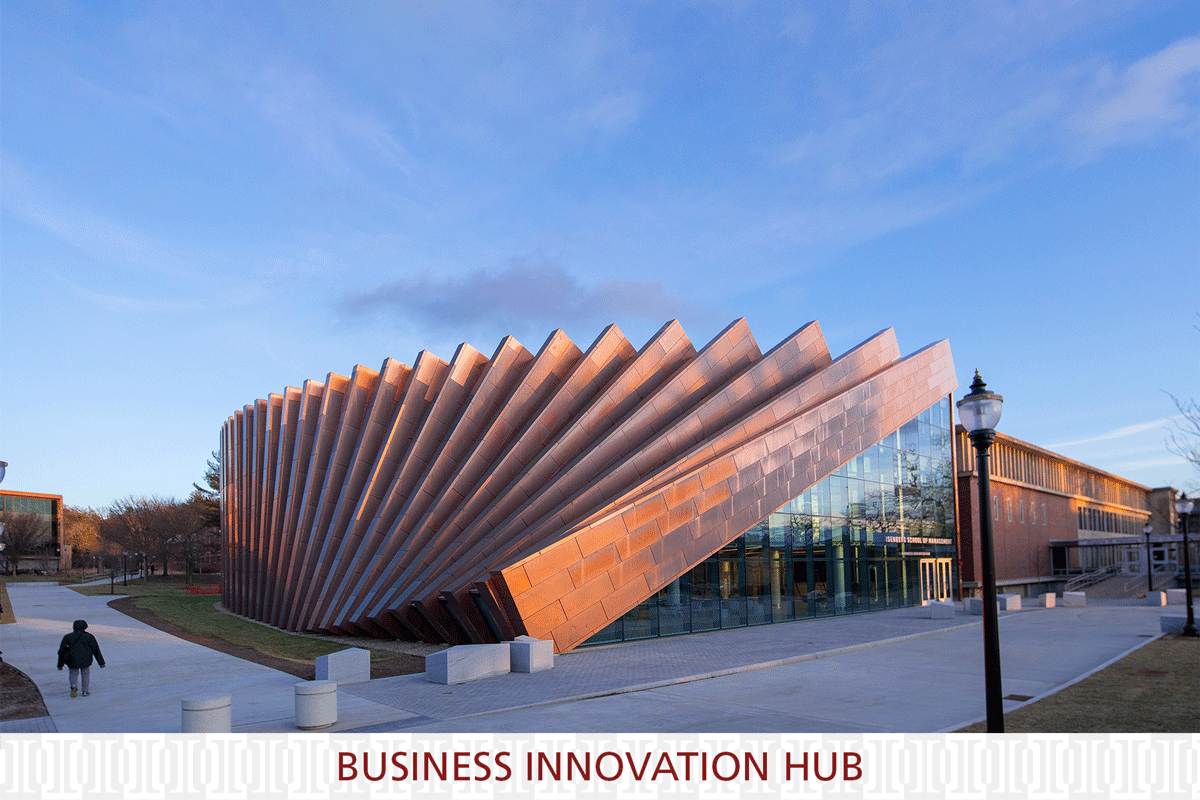
I'm doing my MS in Business Analytics at UMass Amherst's Isenberg School of Management (4.0 GPA). Before this, I worked in grant administration at Aga Khan University, sales at Chevron, and product development at DuPont. That mix of industries is something most analytics students don't have, and it changes how I think about data — I care about what happens after the analysis, not just the numbers themselves.
I'm looking for a Summer or Fall 2026 internship in analytics, operations, or AI automation. I'm OPT/CPT eligible. If that sounds like a fit, reach out.
UMass Amherst, Isenberg School of Management · GPA: 4.0/4.0
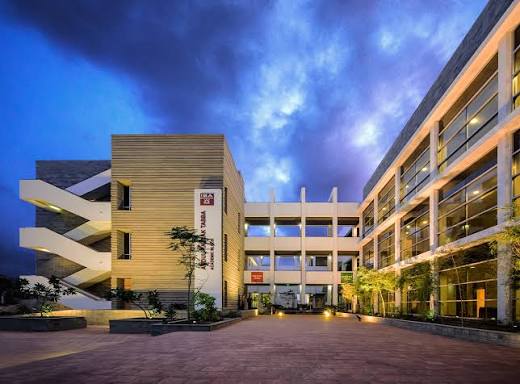
Institute of Business Administration (IBA), Karachi · GPA: 3.25
Click a role to read more.
Click any tool to filter projects by it.
Click a skill above to filter. Click a card to open the project.
Excel / VBA
Compared 15+ U.S. cities across salary, cost of living, healthcare and safety. Built with dynamic slicers, VBA macros and conditional formatting.
View Project →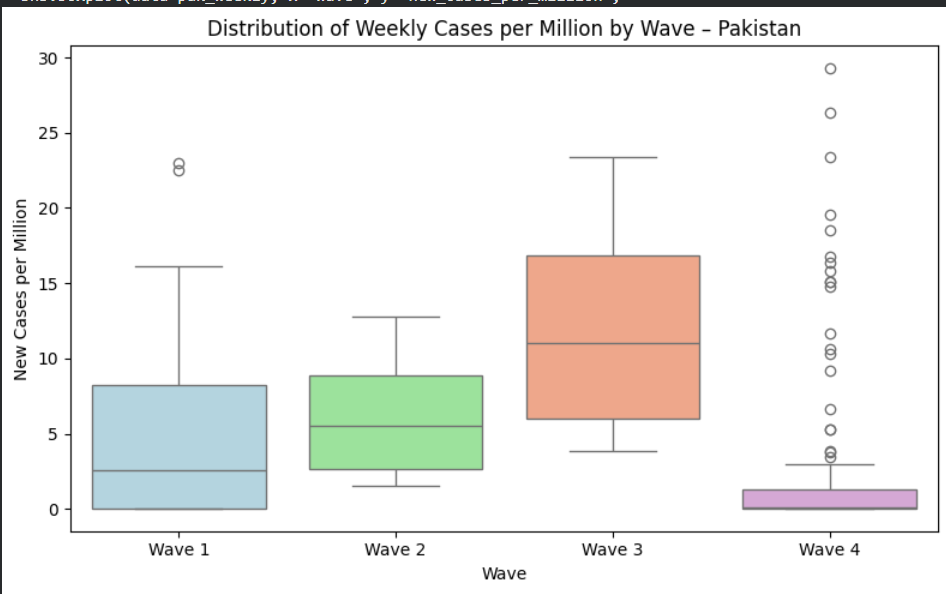
Python · OLS Regression
Built an OLS regression model (R² = 0.767) with a 14-day lag to show how case surges predicted deaths across Pakistan's four pandemic waves.
View Code →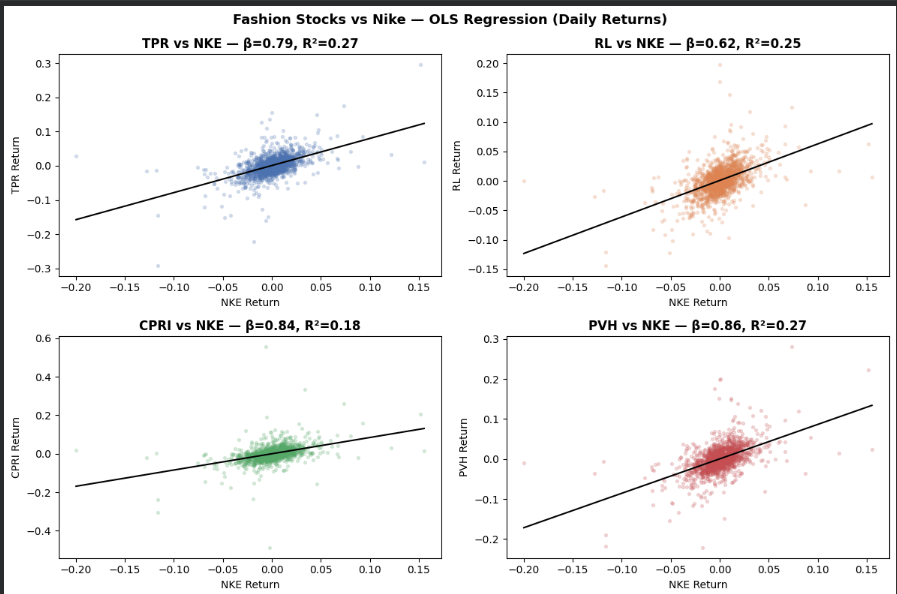
Python · Financial Analytics
Ran correlation and rolling volatility analysis on TPR, RL, CPRI, PVH and NKE from 2019 to 2025. Fashion peers move twice as in sync with each other as they do with Nike.
View Code →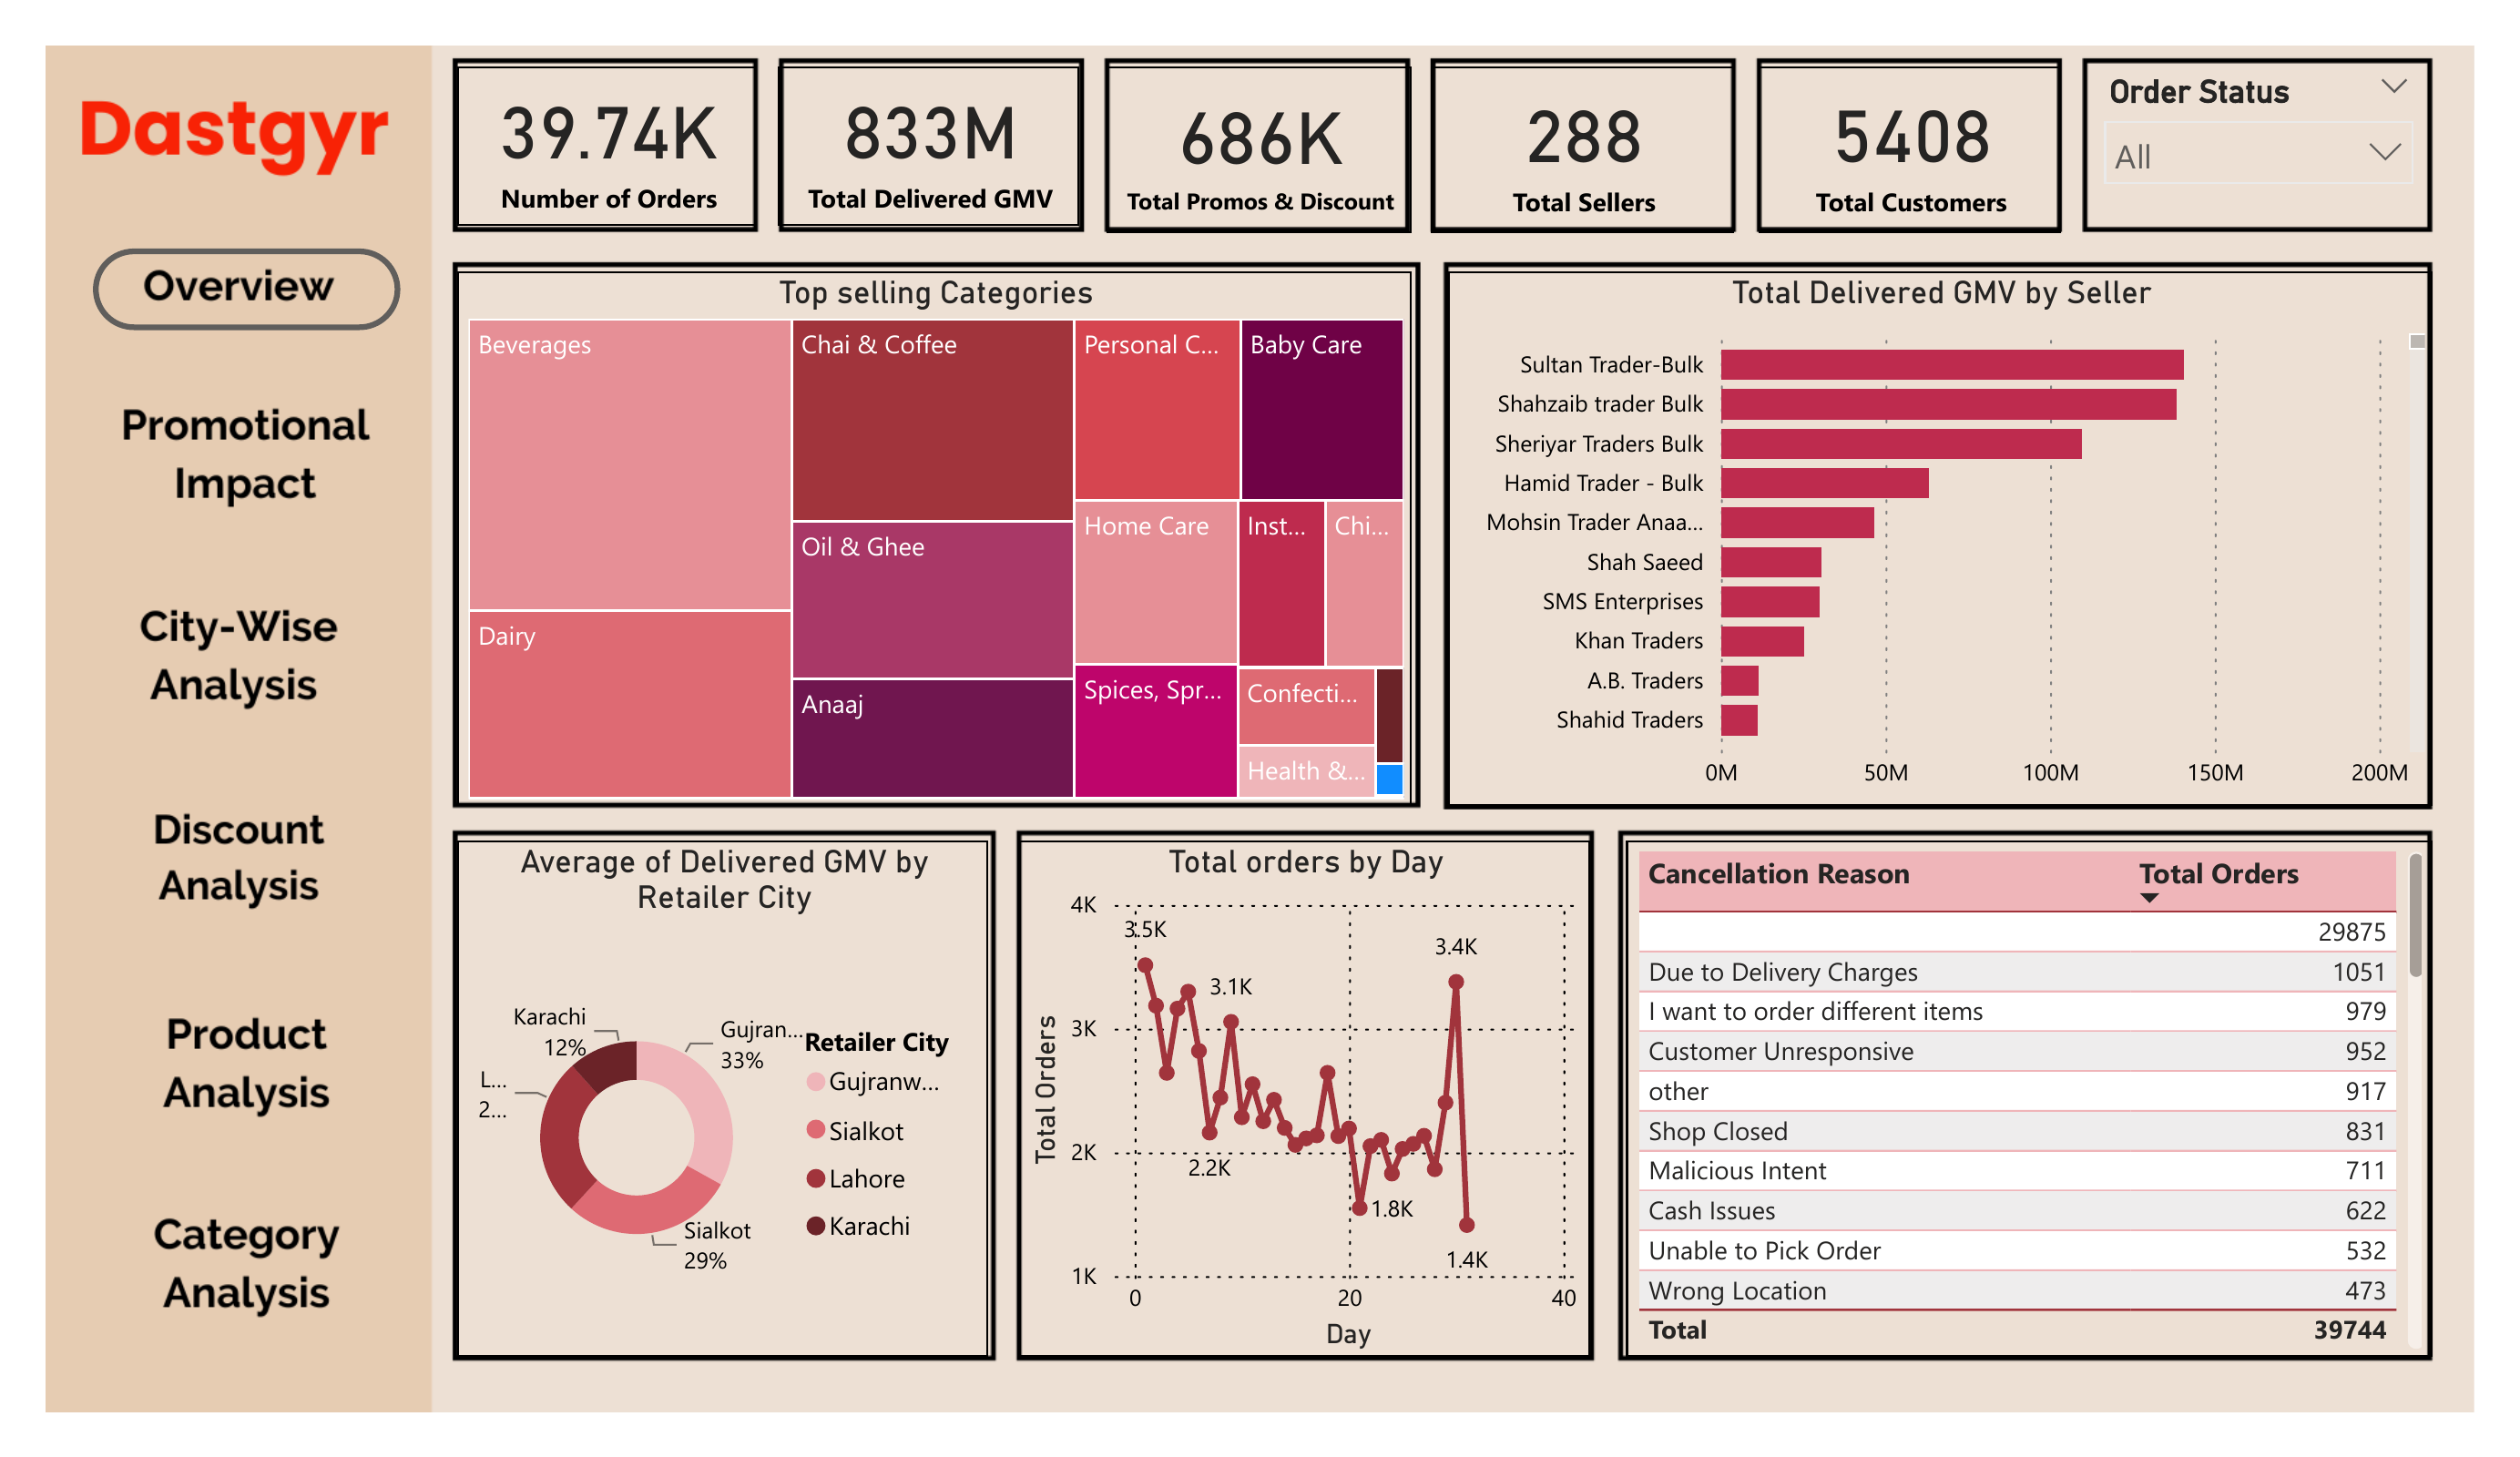
Power BI · DAX
Multi-page Power BI dashboard tracking 833M GMV across 5,408 customers and 288 sellers. Covers order cancellations, city-level segmentation and promo impact.
View Project →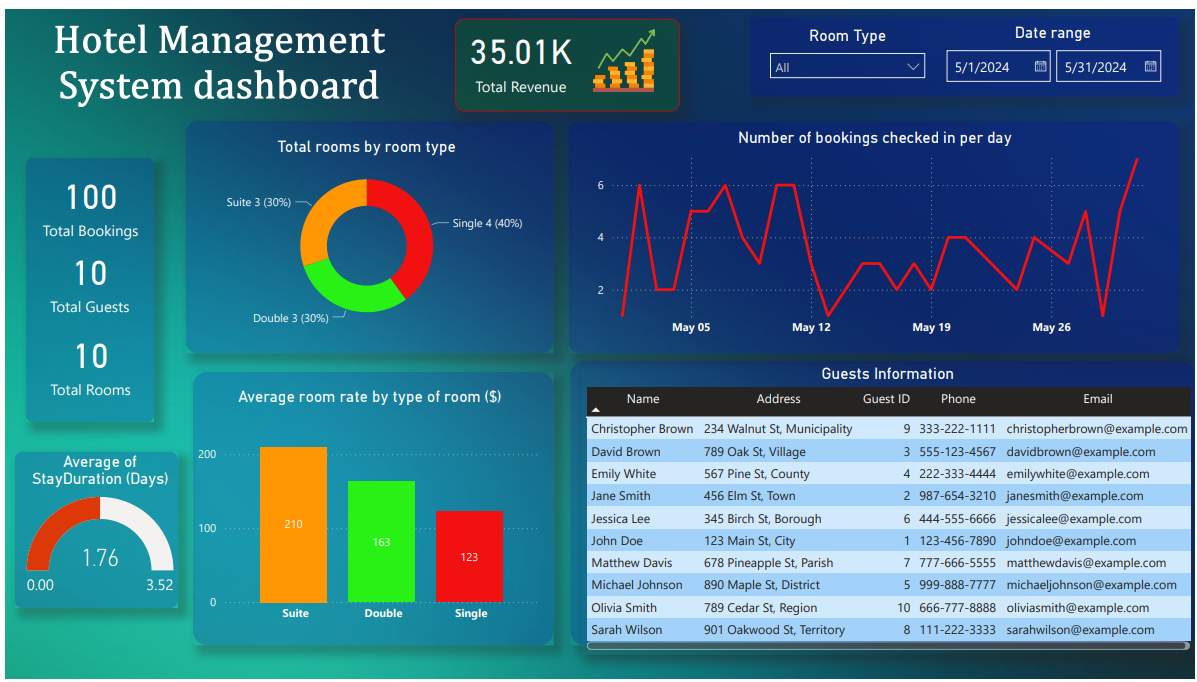
SQL · Power BI
Relational database and Power BI dashboard for Hotel UMass tracking 35K+ reservations, revenue by room type, occupancy trends and staffing.
View Project →Microsoft Excel Collegiate Challenge (MECC) — Regional Participant, Sacred Heart University, 2026